

From a point cloud to a 3D steel model, with the error measured
I built a steel structure, simulated a laser scan of it, and let my scan-to-BIM pipeline rebuild the structure from the points alone. Because I know the original, I could measure every member I got right, every one I missed and every section I could not resolve.
Scan-to-BIM · synthetic benchmark
Why a synthetic scan
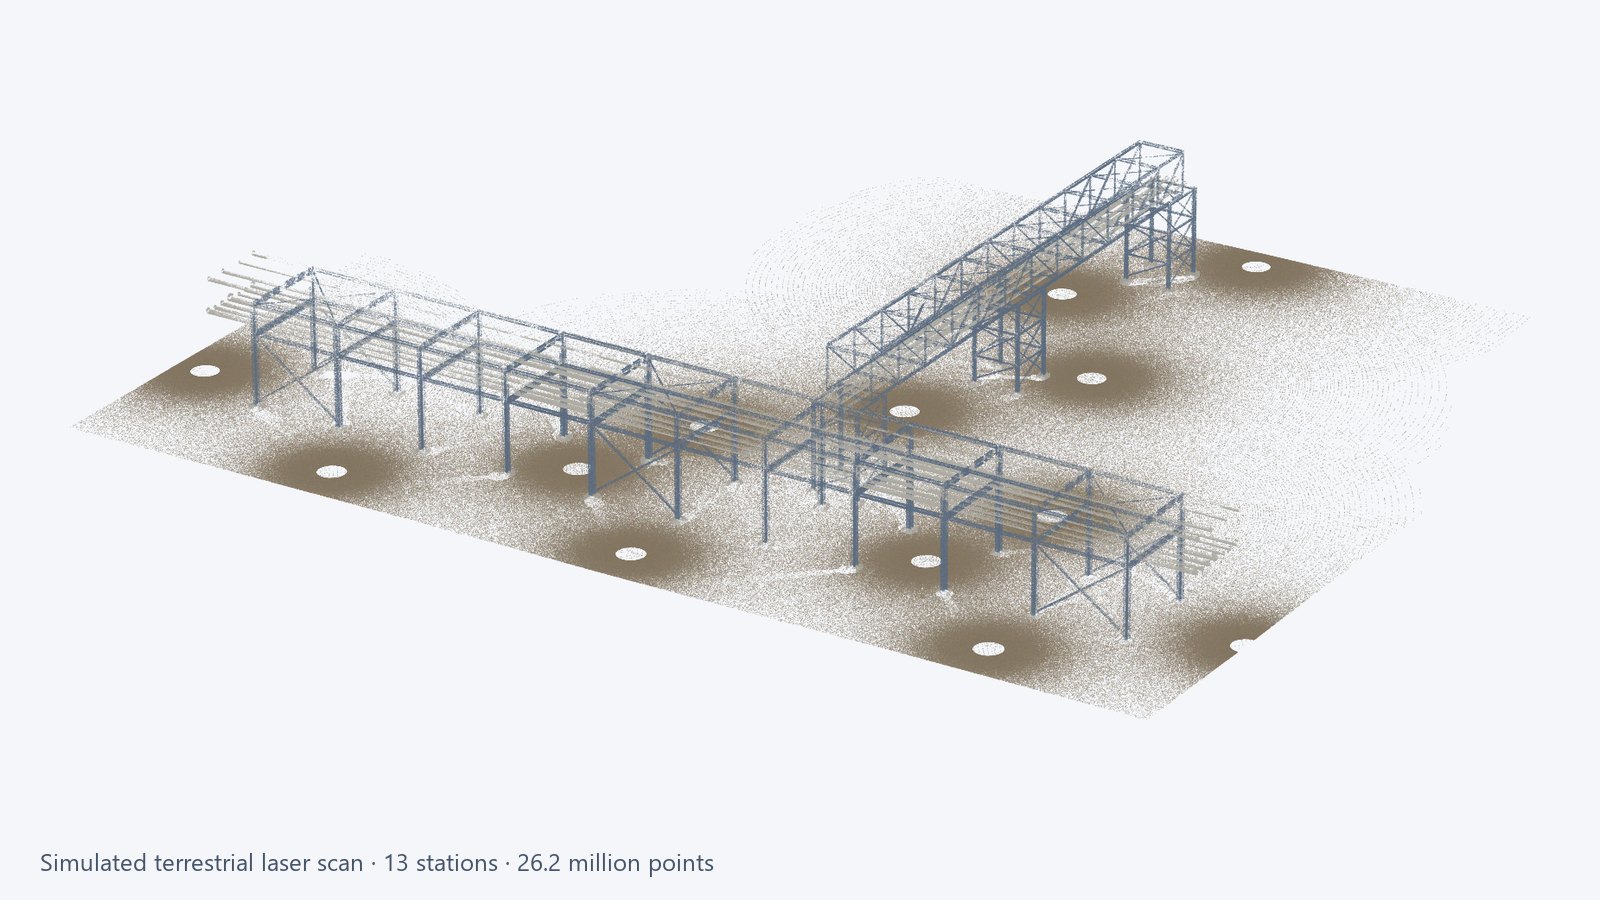
On a real scan nobody knows the exact answer, so accuracy claims are hard to check. Here the answer is known: a two-tier pipe rack and a box truss bridge on braced towers, 294 steel members in standard European sections. I scanned it virtually from 13 ground stations, with realistic range noise, small registration errors between stations, and everything a real scanner misses: faces hidden behind pipes, top faces seen from below, buried foundations.
The pipeline then worked only from the 26.2 million points. Its output was built as a native 3D fabrication model, read back, and compared member by member with the original.
How the pipeline works
Scope and quality check
Extent, runs, support spacing, levels, point spacing and noise, measured from a viewer link or the file before any quote.Columns
Steel faces repeat at every height, so columns separate cleanly from bracing. The section comes from the face positions and is matched to the catalogue.Beams and chords
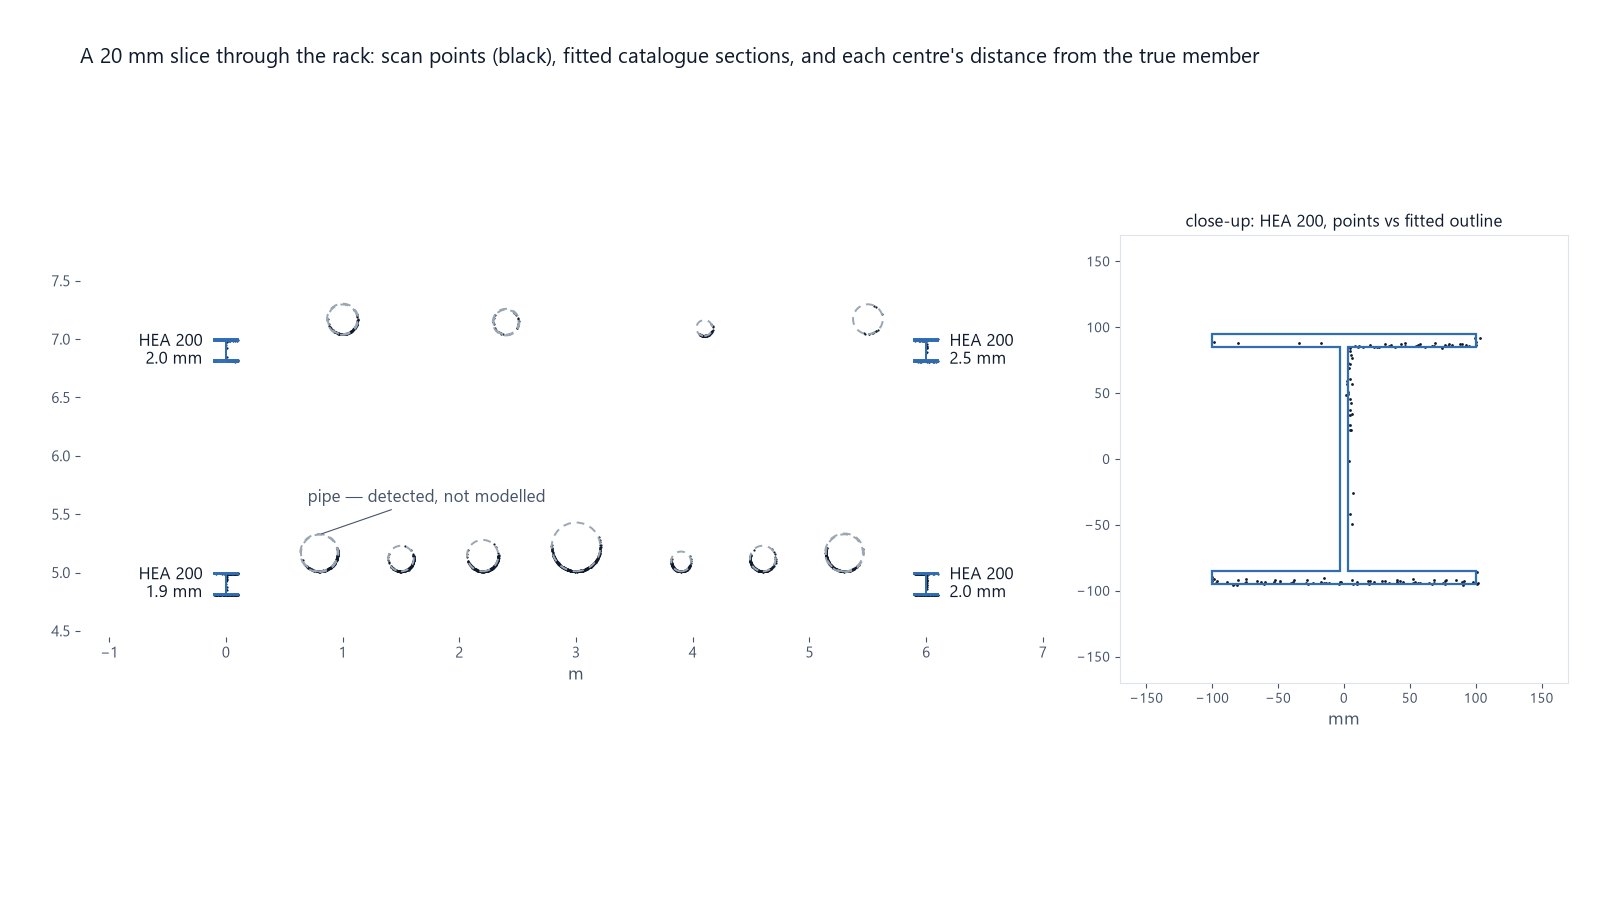
Members found from continuous runs of points. Pipes are recognised and removed, so they don’t distort the steel sections.Bracing and posts
Lines are fitted to what remains. The end of each member is extended until it meets the steel it connects to.Model and IFC
A native 3D fabrication model plus IFC4, with every member carrying its confidence, measured size and match error.
Results, member by member
Each member of the original was compared with what came out of the fabrication model: is it there, how far is its axis from the true axis, and is its section the right catalogue section. Foundations are excluded (buried, so they are modelled at an assumed depth and flagged).
| Member group | Found | Axis error, median / 90% | Section matched |
|---|---|---|---|
| Columns and tower legs | 34 / 34 | 1.2 / 2.4 mm | 33 / 34 |
| Beams, girders, chords and cross-beams | 132 / 132 | 2.0 / 5.3 mm | 115 / 132 |
| Truss posts | 26 / 26 | 11.2 / 30.3 mm | 11 / 26 |
| Bracing and truss diagonals | 93 / 102 | 24.8 / 33.8 mm | 2 / 93 |
| Total | 285 / 294 | 161 / 285 |
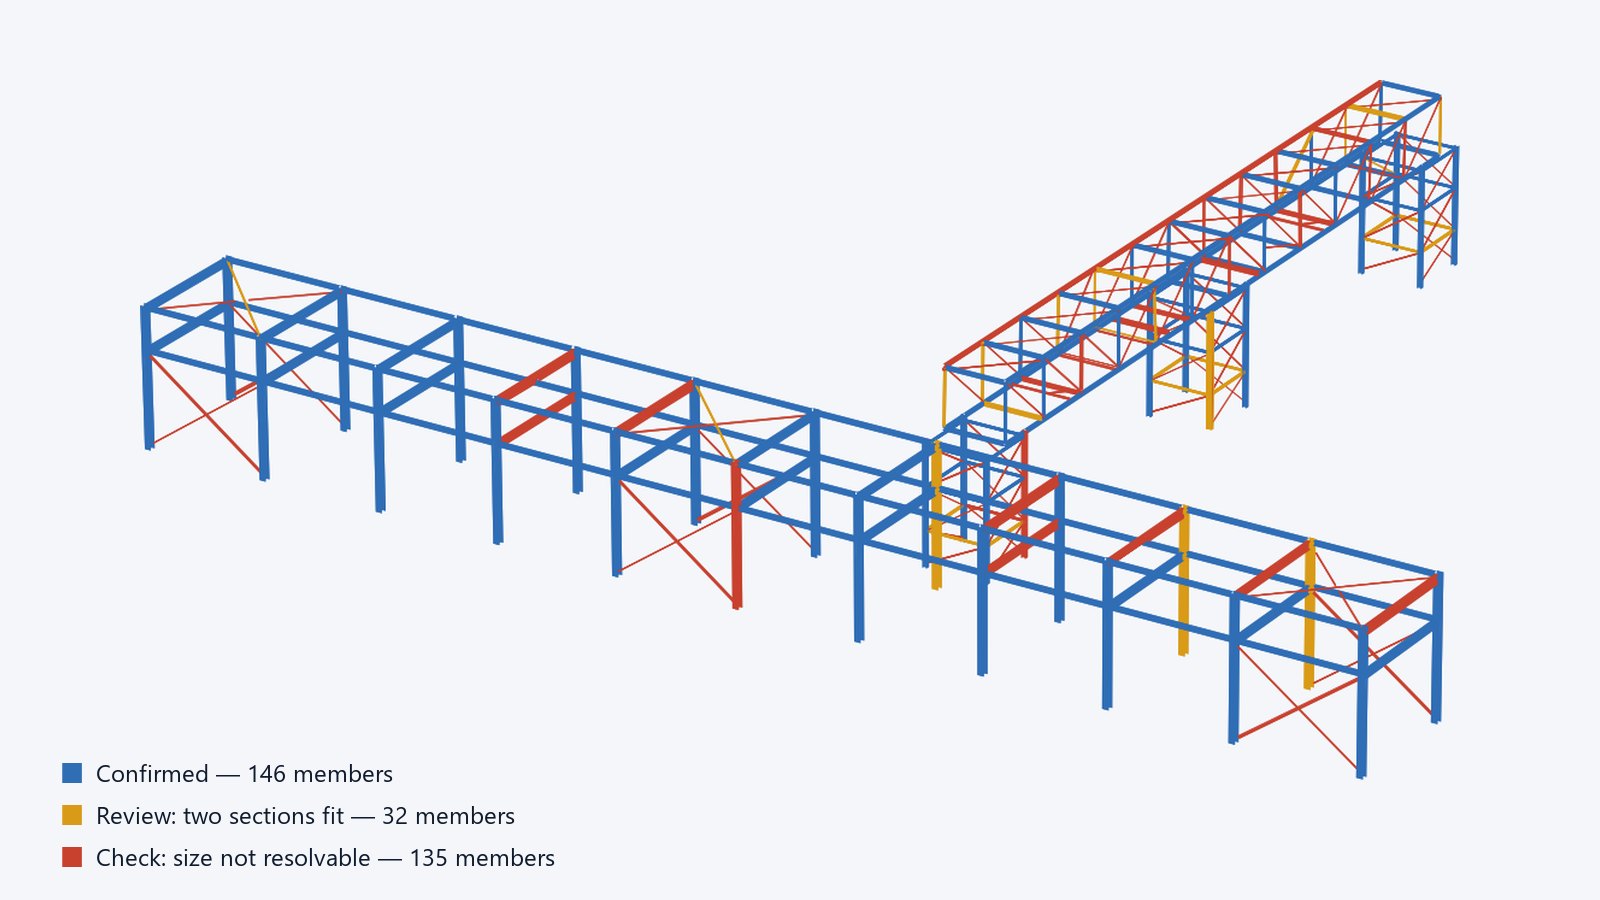
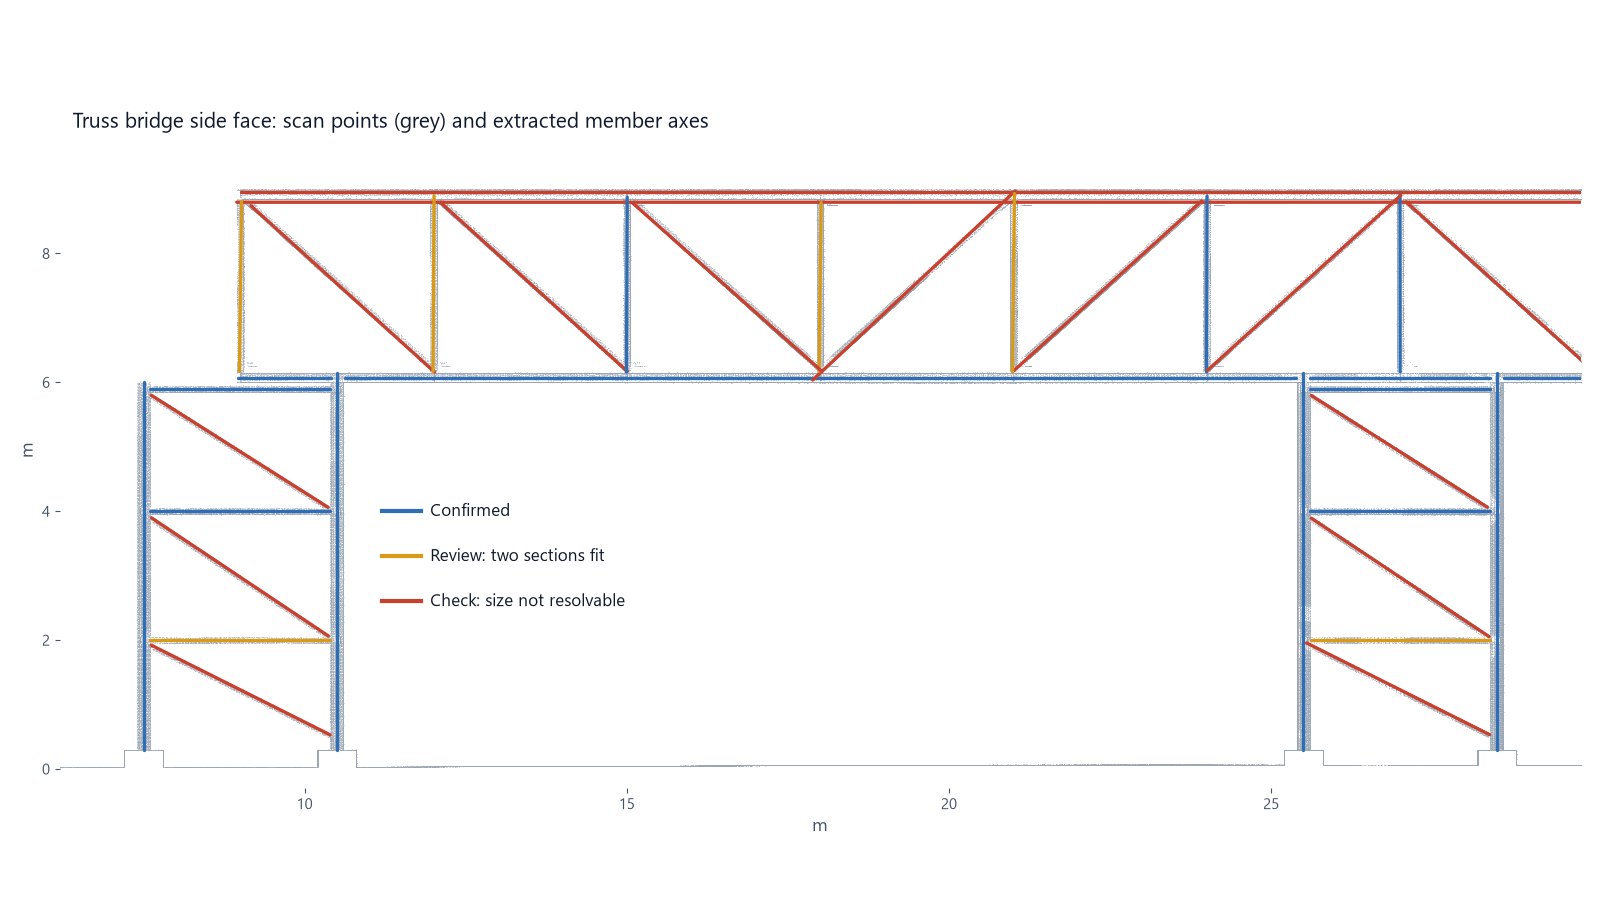
Of the 124 members whose section did not match, 108 are marked Check and 16 Review. None is marked Confirmed. The main frame comes out within a few millimetres. Bracing angles are found and placed, but their size and exact position depend on legs a scanner mostly sees edge-on, so they are left for confirmation.
Flag, don’t guess
Wall and leg thickness
A scan shows outer dimensions, not thickness. I match the nearest catalogue section and write the assumption into the model.
Angles seen edge-on
When only one leg of an angle, or two faces of a box, are visible, the section is ambiguous. The member is modelled and marked for confirmation against the cloud or your records.
Faces hidden from the stations
Top flanges seen only from below and faces behind pipes are measured from what is visible, and flagged when the fit is not clean.
Buried foundations
Pedestal tops are modelled from the scan; depths below ground are assumed and marked as such.
On a real job the flagged members are confirmed against the cloud with you before the model is issued. Review time goes to the members that need it, not to the ones that came out right.
Benchmark details
- Structure
- Two-tier pipe rack, 60 m, 11 bents at 6 m; box truss bridge, 2 × 18 m spans on three braced towers; 294 steel members in standard European sections (HEB, HEA, IPE, SHS, equal angles), plus pedestals and footings.
- Scan simulation
- 13 ground stations, 0.1° angular step, 1.5 mm range noise, small rigid registration error per station, 5 mm thinning; 26.2 million points with colour and intensity, in projected map coordinates.
- Comparison
- The extracted members were built as a native fabrication model, read back from it, and matched to the original by direction, axis distance and overlap. Axis error is the median distance between the true axis and the modelled axis.
- Deliverables
- Native 3D fabrication model, IFC4 with a per-member confidence property, a member list with measured sizes and flags, and the scope and quality report.
This page reports a synthetic benchmark: the structure and the scan were generated so the result could be measured. Results on client scans will be added as projects are completed.
Have a point cloud of a steel structure?
Send a viewer link or a sample file. I reply with a scope and quality check (extent, runs, point spacing, what the scan can and cannot resolve) before quoting.
info@structomat.com